
Group Summary: Scale Scores and Performance Levels
Getting Started
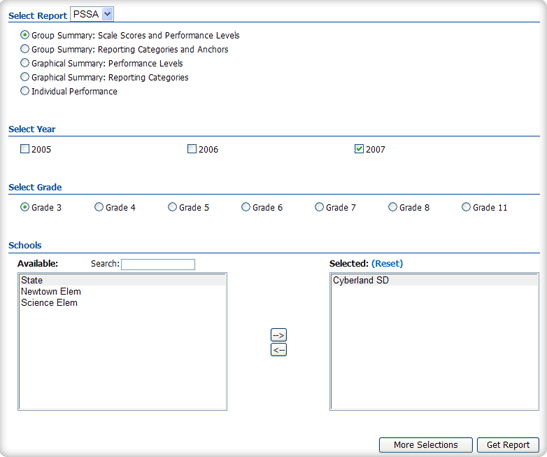
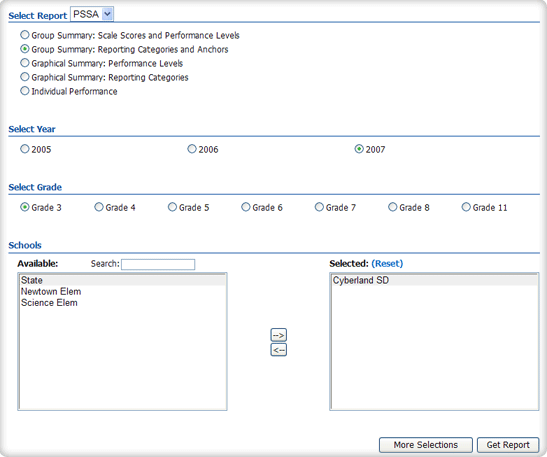
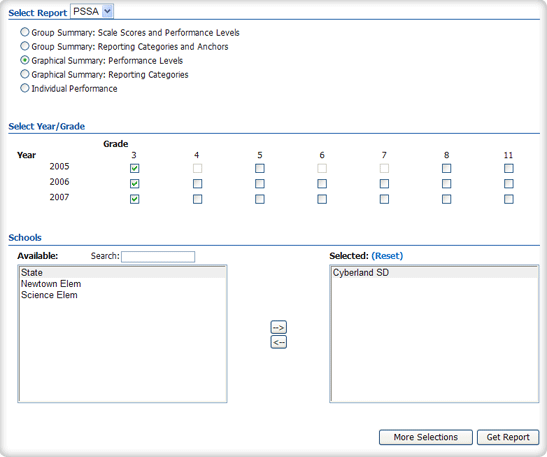
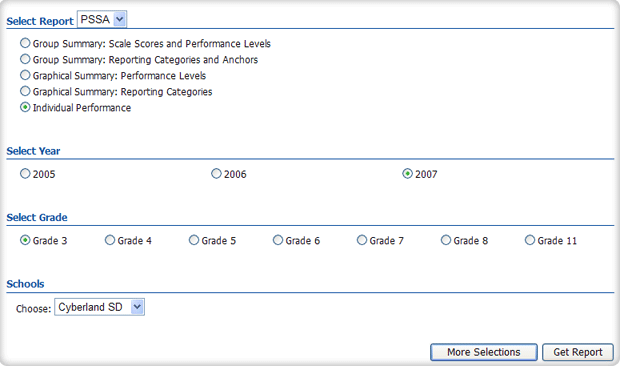
Group Summary: Scale Scores and Performance Levels provides summary statistics including number tested, mean scale score, number and percent of students at each performance level, and percent of students at and above proficiency. Users can select content areas, statistics, one or more years, demographic variables for summary, and different report views. Users can also drill down to subgroup or individual student results. To get started:- Select "Group Summary: Scale Scores and Performance Levels" under "Select Report."
- Select year(s).
- Select grade.
- Select state, district(s), and/or school(s).
- Click "Get Report" to get a report with default selections (you can customize the report later on the report page), or click "More Selections" to customize your report now.
Sample Report
If you selected "Get Report," you should see a report that looks similar to the following sample:
Advanced Features
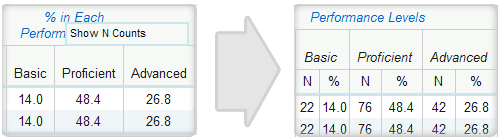
Once you view your report, you can choose to save your report for later viewing or download it as a PDF or CSV file. A CSV is a text file that opens directly in Microsoft Excel. In addition, you can:- Show N Counts for Percentages: To see, for example, how many students met the standard in Mathematics, click the "% in Each Performance Level" column and then click "Show N Counts."
- Drill-Down Disaggregation: You can further disaggregate a visible group by clicking on it in the first column. For example, if you see a report for Hispanic females and you would like to analyze those females by their LEP statuses, click on "Hispanic," then "Disaggregate," then "LEP."
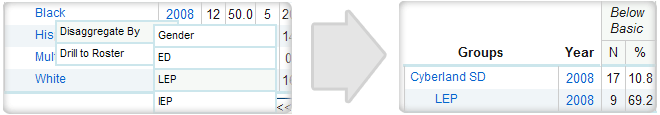
- Drill to Roster: Click on any group or year and select "Drill to Roster" to view the roster of students that comprise the data for that group/year.
Using the Customization Tabs
- Years
This feature allows the user to select years. For example, to see scores for the year 2008, click on "2008" and then click "Submit."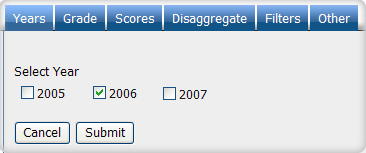
- Grade
This feature allows the user to select a grade. For example, to see scores for grade 3, click on "Grade 3" and then on "Submit."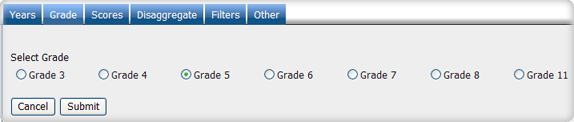
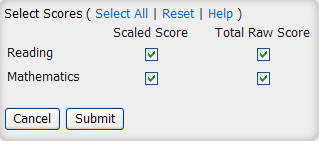
- Scores
This feature allows the user to select which scores are shown in the report. For example, to see the mean scale scores, select "Mean Scale Score" and click "Submit."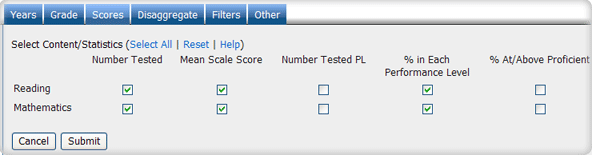
- Disaggregate
This feature allows the user to disaggregate the report by different subgroups. For example, to see statistics for different ethnicities, first select "Ethnicity" and then click "Submit."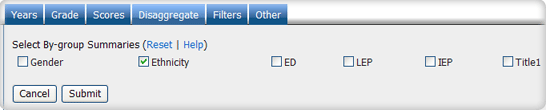
- Filters
This feature allows the user to include or exclude students based on demographic characteristics. To include one or more subgroups of students, click on the desired subgroup(s) of demographic variables from the drop-down list. Then, click on the word "and" or "or" to specify the logical relationship between the subgroups selected.
For example, to view students who are hispanic females, first click on "Female" under gender and "hispanic" under ethnicity, then select "and" for the logical relationship. This will display the scores of students who are hispanic AND female. Using the logical relationship "or" will display the scores for all hispanic students and for all female students, independent of each other.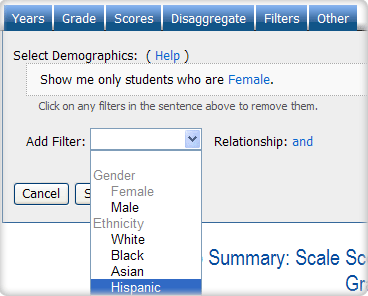
Group Summary: Reporting Categories and Anchors
Getting Started
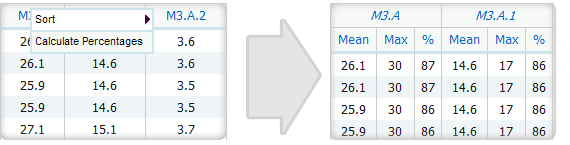
Group Summary: Reporting Categories and Anchors provides summary statistics, including number tested, average raw score, maximum score possible, and percent of score points earned for each reporting category and anchor. Users can select content areas, statistics, and demographic variables for summary and can drill down to subgroup or individual student results. To get started:- Select "Group Summary: Reporting Categories and Anchors" under "Select Report."
- Select year(s).
- Select a grade.
- Select state, district(s) or school(s).
- Click "Get Report" to create a report with default selections (you can customize the report later on the report page), or click "More Selections" to customize your report now.
Sample Report
If you selected "Get Report," you should see a report that looks similar to the following sample:
Advanced Features
Once you view your report, you can print it directly from your browser. You can also save the report for later online access, or download it as an Excel CSV or PDF file. An Excel CSV is simply a text file that opens directly in Microsoft Excel. You can also:- Calculate N Counts for Percentages: To see, for example, how many students met the standard in Mathematics, click the "% Advanced/ Proficient" column and then click "Calculate N."
- Drill-Down Disaggregation: You can further disaggregate a visible group by clicking on it in the first column. For example, if you see a report for Hispanic males and you would like to analyze those males by their ELL statuses, click on "Hispanic," then "Disaggregate," then "ELL."
Using the Customization Tabs
- Year
This feature allows the user to select the year(s). For example, to see scores for the year 2008, first select "2008" and then click "Submit."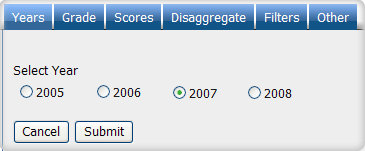
- Grade
This feature allows the user to select a grade. For example, to see scores for grade 3, click on "Grade 3" and then on "Submit."
- Scores
This feature allows the user to select which scores are shown in the report. For example, to see the total raw scores, select "Total Raw Score" and click "Submit."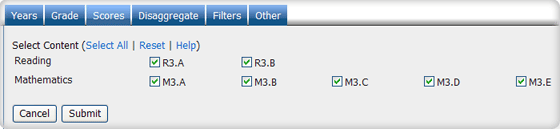
- Disaggregate
This feature allows the user to disaggregate the report by different subgroups. For example, to see statistics for different ethnicities, first select "Ethnicity" and then click "Submit."
- Filters
This feature allows the user to include or exclude students based on demographic characteristics. To include one or more subgroups of students, click on the desired subgroup(s) of demographic variables from the drop-down list. Then, click on the word "and" or "or" to specify the logical relationship between the subgroups selected.
For example, to view students who are hispanic females, first click on "Female" under gender and "hispanic" under ethnicity, then select "and" for the logical relationship. This will display the scores of students who are hispanic AND female. Using the logical relationship "or" will display the scores for all hispanic students and for all female students, independent of each other.
Graphical Summary: Performance Levels
Getting Started
Graphical Summary: Performance Levels provides summary graphs, including bar charts, pie charts, histograms, and line graphs. The statistics to be graphed include percent at each performance level, percent at/above proficiency, and percent below proficiency. Users can select content, statistics, demographical variables, and multiple grades/years for year to year or cohort comparison. Users can also drill down to individual student results. To get started:- Select "Performance Level Summary Report" under "Select Report."
- Select year(s) and grade(s).
- Select school(s) and/or district(s).
- Click "Get Report" to get a report with default selections (you can later customize the report on the report page), or click "More Selections" to customize your report now.
Sample Report
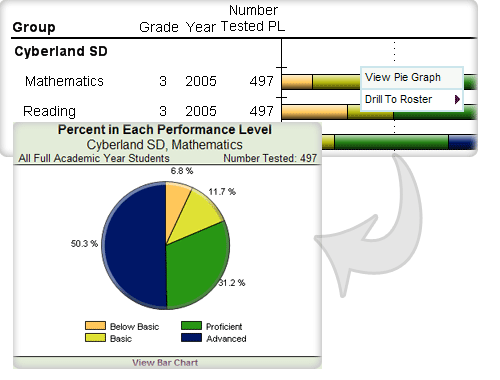
If you selected "Get Report," you should see a report that looks similar to the following sample:
Advanced Features
Once you view your report, you can print it directly from your browser, save it online for later viewing, or download it as a PDF file. You can also:- Drill Down to Roster: Click on any bar in the chart to view a roster of the students that comprise the data for that bar.
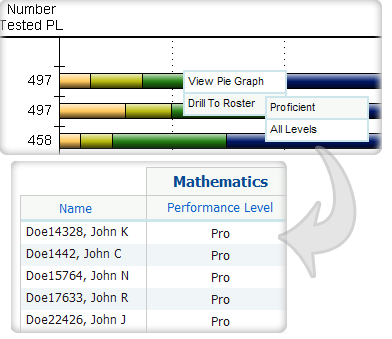
- Pie Graph: You can see a pie graph by clicking on a bar and choosing "View Pie Graph."
Using the Customization Tabs
- Report Type
This feature allows the user to select a different report type.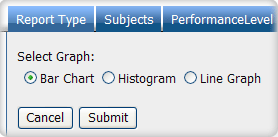
- Subjects
This feature allows the user to select different content areas.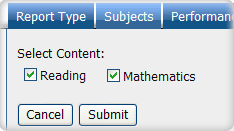
- Levels
This feature allows the user to select different performance levels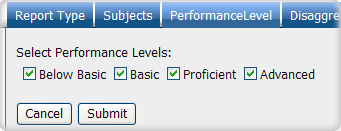
- Disaggregate
This feature allows the user to disaggregate the report by different subgroups. For example, to see statistics for different ethnicities, first select "Ethnicity" and then click "Submit."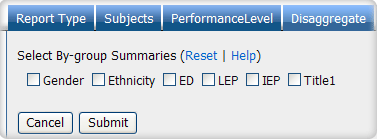
- Filters
This feature allows the user to include or exclude students based on demographic characteristics. To include one or more subgroups of students, click on the desired subgroup(s) of demographic variables from the drop-down list. Then, click on the word "and" or "or" to specify the logical relationship between the subgroups selected.
For example, to view students who are hispanic females, first click on "Female" under gender and "hispanic" under ethnicity, then select "and" for the logical relationship. This will display the scores of students who are hispanic AND female. Using the logical relationship "or" will display the scores for all hispanic students and for all female students, independent of each other.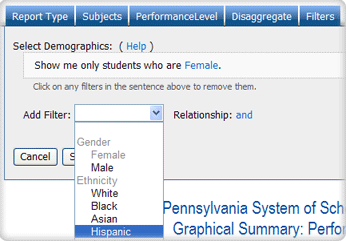
Graphical Summary: Reporting Categories
Getting Started
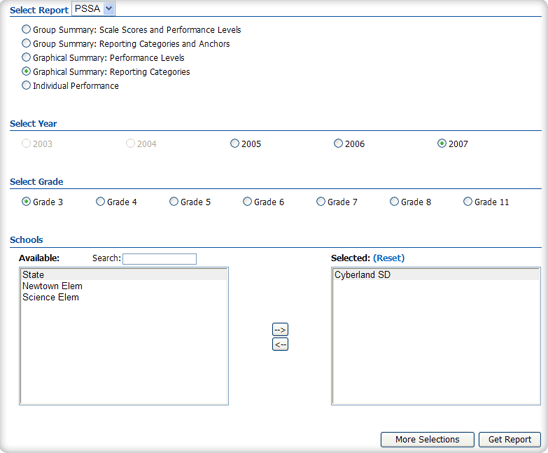
Graphical Summary: Reporting Categories provides a bar chart to display the percent of score points earned for each reporting category. Users can select content areas and demographic variables for summary and can drill down to individual student results. To get started:- Select "Graphical Summary: Reporting Categories" under "Select Report."
- Select year.
- Select grade.
- Select the school(s) and/or district(s).
- Click "Get Report" to create a report with default selections (you can later customize the report on the report page), or click "More Selections" to customize your report now.
Sample Report
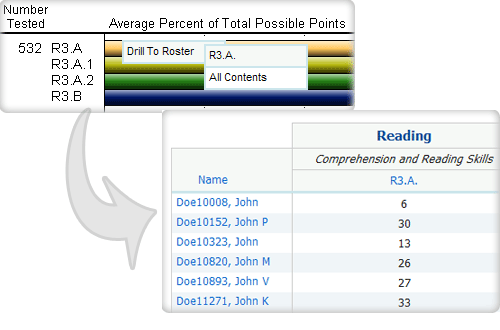
If you selected "Get Report," you should see a report that looks similar to the following sample:
Advanced Features
Once you view your report, you can print it directly from your browser, save it online for later viewing, or download it as a PDF file.- Drill Down to Roster: Click on any bar in the chart to view the roster of students that comprise the data for that bar.
Using the Customization Tabs
- Subjects
This feature allows the user to select different content areas.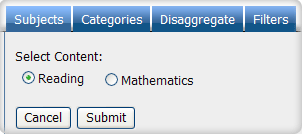
- Categories
This feature allows the user to select one or more reporting categories.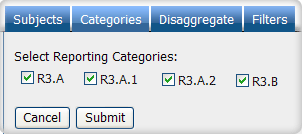
- Disaggregate
This feature allows the user to disaggregate the report by different subgroups. For example, to see statistics for different ethnicities, first select "Ethnicity" and then click "Submit."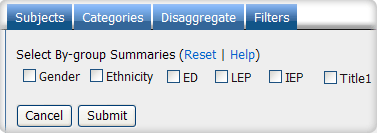
- Filters
This feature allows the user to include or exclude students based on demographic characteristics. To include one or more subgroups of students, click on the desired subgroup(s) of demographic variables from the drop-down list. Then, click on the word "and" or "or" to specify the logical relationship between the subgroups selected.
For example, to view students who are hispanic females, first click on "Female" under gender and "hispanic" under ethnicity, then select "and" for the logical relationship. This will display the scores of students who are hispanic AND female. Using the logical relationship "or" will display the scores for all hispanic students and for all female students, independent of each other.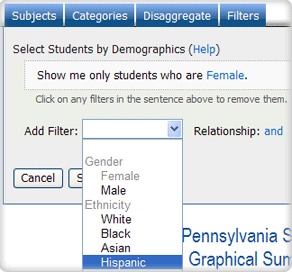
Individual Performance
Getting Started
Individual Performance: PSSA provides individual student scores including scale scores, performance levels, total raw scores by item type, and raw scores by reporting category and anchors. It also provides student level data including local and state ID, demographic information, and score attribution information. Users can select subgroups of students by filtering options, sort data in ascending or descending order, and perform Ad Hoc queries on any score variable(s) to obtain summary reports or graphs. To get started:- Select "Individual Performance" under "Select Report."
- Select the year.
- Select the grade.
- Select the school or district.
- Click "Get Report" to create a report with default selections (you can later customize the report on the report page), or click "More Selections" to customize your report
now.
Sample Report
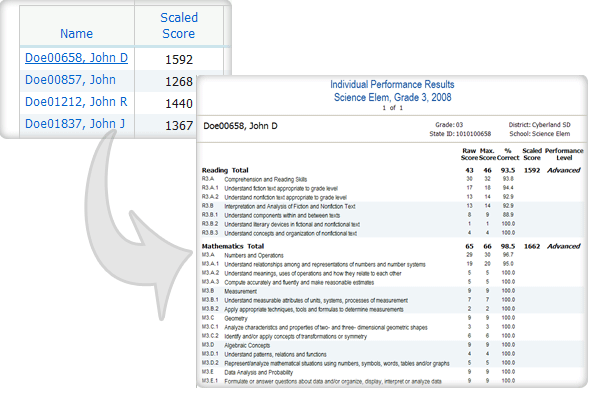
If you selected "Get Report," you should see a report that looks similar to the following sample:
Advanced Features
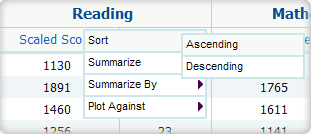
Once you view your report, you can print it directly from your browser. You can also save the report online for later access or download it as an Excel CSV or PDF file. An Excel CSV is simply a text file that opens directly in Microsoft Excel. You can also:- Sort the report by clicking the column of interest. For example, to see the students
with highest total scores first:
- View a printable individual report of a particular student by clicking on that
student's name.
- Instantly see summary statistics, such as mean and standard deviation,
by clicking on its column. For example, to see a summary of the total scores:
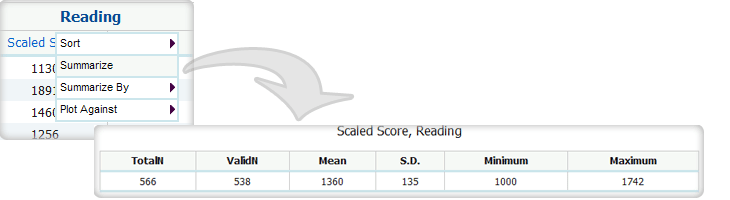
- Also, see summary statistics divided into demographic subgroups, such as gender or ethnicity, by clicking on "Summarize By."
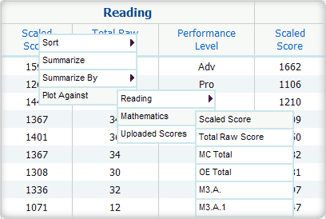
- Create a scatter plot of scores by clicking on the scaled score or total raw score that you want for your x-axis. Then, choose “Plot Against” and select another scaled score or total raw score for your y-axis. The scatter plot will open in a new window. (See the Scatter Plot help article for advanced features.)
- Generate a frequency distribution for performance levels by clicking on a performance level column and choosing "Distribute."
- Also, generate a frequency distribution divided into demographic subgroups by clicking on a performance level column and choosing "Distribute By."
- Create a cross-tab report by clicking on a performance level, choosing "Cross-Tab Report," and clicking on another performance level.
Using the Customization Tabs
- Year
This feature allows the user to select the year(s). For example, to see scores for the year 2008, first select "2008" and then click "Submit."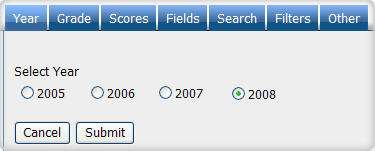
- Grade
This feature allows the user to select a grade. For example, to see scores for grade 3, click on "Grade 3" and then on "Submit."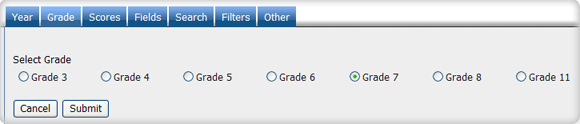
- Scores
This feature allows the user to select which scores are shown in the report. For example, to see the mean scale scores, select "Mean Scale Score" and click "Submit."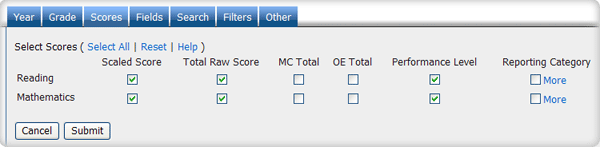
- Fields
This feature allows the user to disaggregate the report by different subgroups. For example, to see results for different ethnicities, select "Ethnicity" and then click "Submit."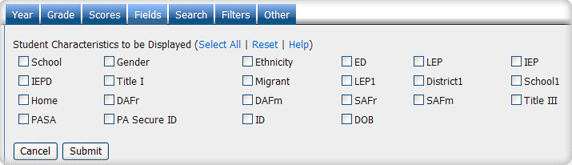
- Search
This feature allows the user to search students by different criteria. For example, to see students with the first name John, select "First Name" from the first drop-down list, type "John" in the input box, and then click "Submit."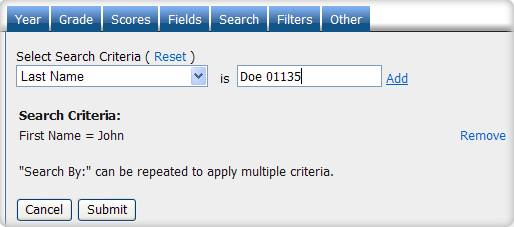
- Filters
This feature allows the user to include or exclude students based on demographic characteristics. To include one or more subgroups of students, click on the desired subgroup(s) of demographic variables from the drop-down list. Then, click on the word "and" or "or" to specify the logical relationship between the subgroups selected.
For example, to view students who are hispanic females, first click on "Female" under gender and "hispanic" under ethnicity, then select "and" for the logical relationship. This will display the scores of students who are hispanic AND female. Using the logical relationship "or" will display the scores for all hispanic students and for all female students, independent of each other.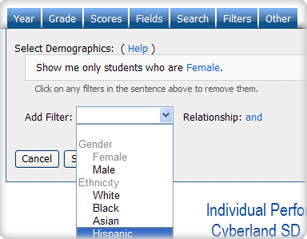
Longitudinal Individual Performance Report
Getting Started
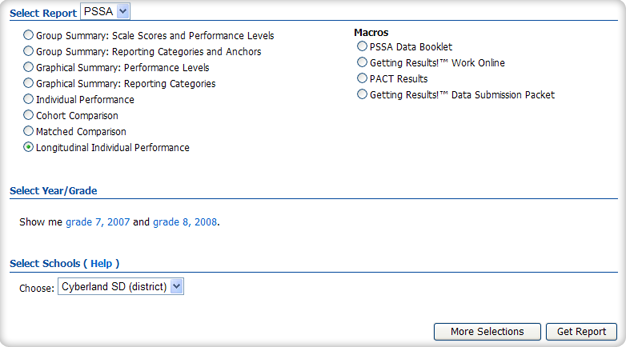
The Longitudinal Individual Performance Report provides a roster list of scores and student data for multiple years. By selecting a year from the main menu, users can generate a roster report that matches a student’s current score results with previous grades/years. In addition, the user can produce an individual student report for any given year by selecting the student’s last name. To get started:- Select "Longitudinal Individual Performance" under "Select Report"
- Select the years/grades. The years/grades may already be selected. To make changes, click on the selections (in blue) and the drop-down menus will reappear.
- Select state, district, or school.
- Click "Get Report" to create a report with default selections (you can later customize the report on the report page), or click "More Selections" to customize your report now.
Sample Report
If you selected "Get Report," you should see a report that looks similar to the following sample:
Advanced Features
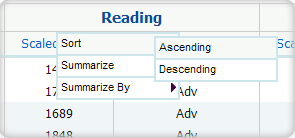
Once you view your report, you can print it directly from your browser. You can also save the report for later online access, or download it as an Excel CSV or PDF file. An Excel CSV is simply a text file that opens directly in Microsoft Excel. You can also:- Sort the report by clicking the column of interest, then "Sort." For example, to see the students with the highest scale scores first:
- View a printable Individual report of a particular student by clicking on that student's name.
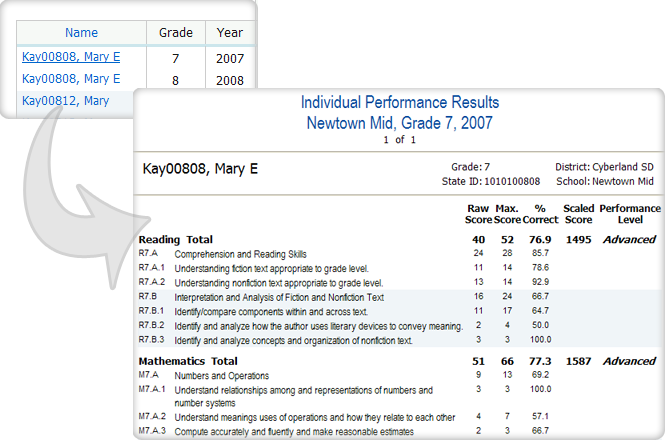
- Instantly see summary statistics, such as mean and standard deviation, by clicking on its column, then on "Summarize." For example, to see a summary of the scale scores:
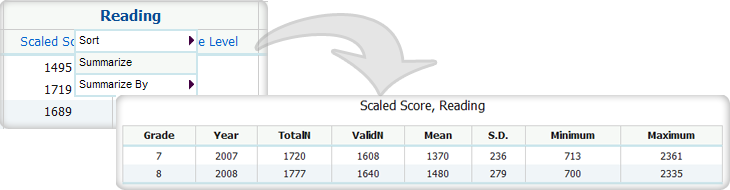
- Also, see summary statistics divided into demographic subgroups such as gender or ethnicity, by clicking on "Summarize By."
Using the Customization Tabs
- Scores
This feature allows the user to select which scores are shown in the report. For example, to see the mean scale scores, select "Mean Scale Score" and click "Submit."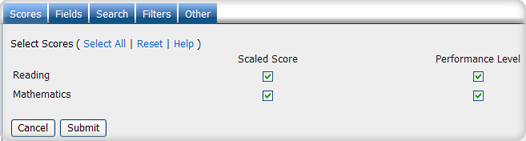
- Fields
This feature allows the user to disaggregate the report by different subgroups. For example, to see results for different ethnicities, select "Ethnicity" and then click "Submit."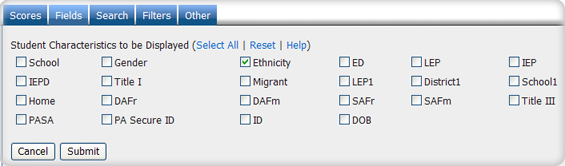
- Filters
This feature allows the user to include or exclude students based on demographic characteristics. To include one or more subgroups of students, click on the desired subgroup(s) of demographic variables from the drop-down list. Then, click on the word "and" or "or" to specify the logical relationship between the subgroups selected.
For example, to view students who are hispanic females, first click on "Female" under gender and "hispanic" under ethnicity, then select "and" for the logical relationship. This will display the scores of students who are hispanic AND female. Using the logical relationship "or" will display the scores for all hispanic students and for all female students, independent of each other.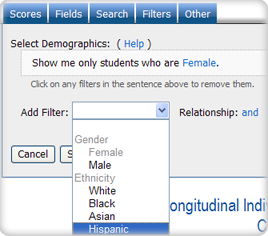
- Search
This feature allows the user to search students by different criteria. For example, to see students with the first name John, select "First Name" from the first drop-down list, type "John" in the input box, and then click "Submit."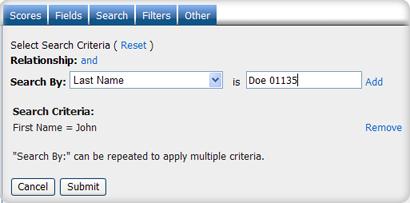
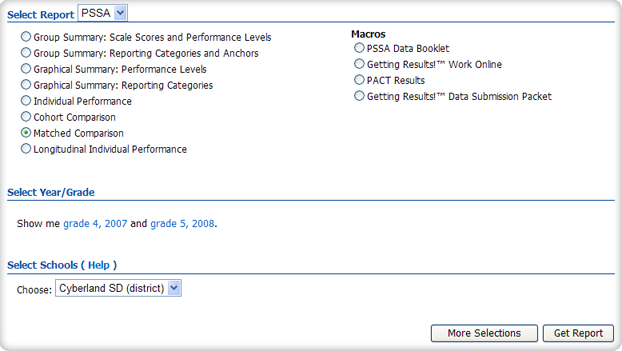
Matched Comparison Report
Getting Started
The Matched Comparison Report provides a two-way table to show the number/percent of students in each performance level across two years/grades for matched cohorts. The user can use the scroll down feature to switch among number tested, percentage of each performance level, and row and column percentages. Selecting a performance level value from the report directs the user to a longitudinal roster report. To get started:- Select "Matched Comparison" under "Select Report"
- Select the years/grades. The years/grades may already be selected. To make changes, click on the selections (in blue) and the drop-down menus will reappear.
- Select state, district, or school.
- Click "Get Report" to create a report with default selections (you can later customize the report on the report page), or click "More Selections" to customize your report now.
Sample Report
If you selected "Get Report," you should see a report that looks similar to the following sample:
Advanced Features
Once you view your report, you can print it directly from your browser. You can also save the report for later online access or download it as a PDF file.Using the Customization Tabs
- Levels
This feature allows the user to select different performance levels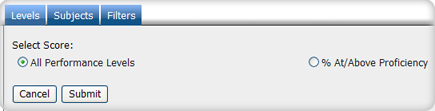
- Subject
This feature allows the user to select which subject should be shown in the report.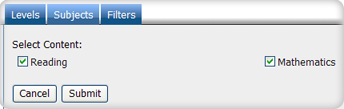
- Filters
This feature allows the user to include or exclude students based on demographic characteristics. To include one or more subgroups of students, click on the desired subgroup(s) of demographic variables from the drop-down list. Then, click on the word "and" or "or" to specify the logical relationship between the subgroups selected.
For example, to view students who are hispanic females, first click on "Female" under gender and "hispanic" under ethnicity, then select "and" for the logical relationship. This will display the scores of students who are hispanic AND female. Using the logical relationship "or" will display the scores for all hispanic students and for all female students, independent of each other.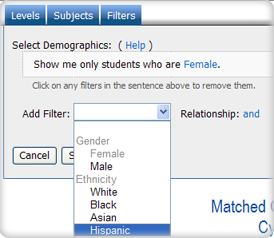
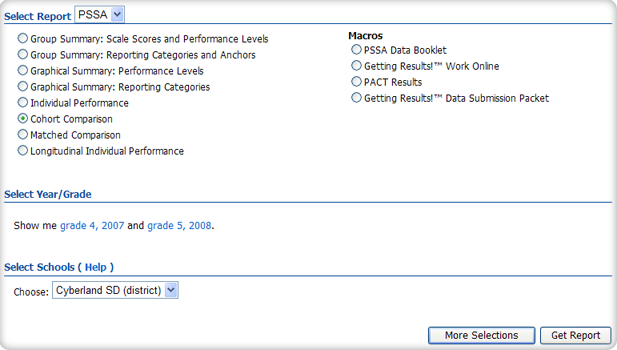
Cohort Comparison Report
Getting Started
The Cohort Comparison Report provides summary results for matched cohorts (students matched by state ID) across multiple years/grades, beginning in 2008. To get started:- Select "Cohort Comparison" under "Select Report"
- Select the years/grades. The years/grades may already be selected. To make changes, click on the selections (in blue) and the drop-down menus will reappear.
- Select state, district, or school.
- Click "Get Report" to create a report with default selections (you can later customize the report on the report page), or click "More Selections" to customize your report now.
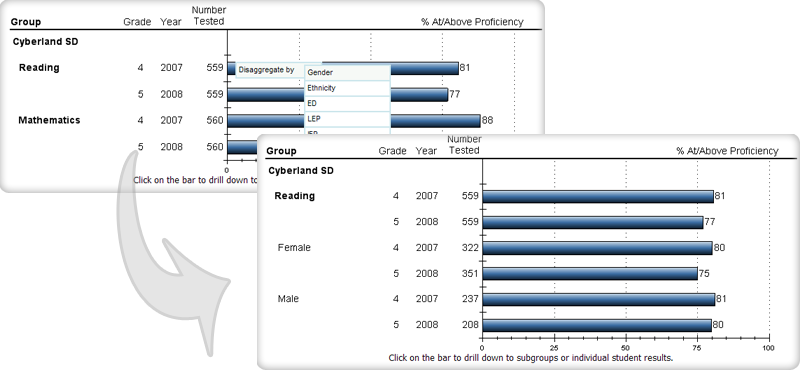
Sample Report
If you selected "Get Report," you should see a report that looks similar to the following sample:
Advanced Features
Once you view your report, you can print it directly from your browser. You can also save the report for later online access or download it as a PDF file.- Drill Down Disaggregation: You can further disaggregate a visible group by clicking on any bar in the chart.
Using the Customization Tabs
- Report
This feature allows the user to select a different report type.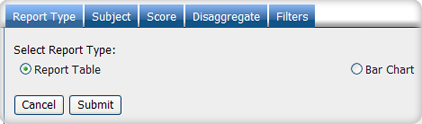
- Subject
This feature allows the user to select which subject should be shown in the report.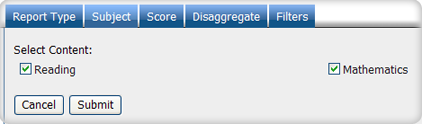
- Scores
This feature allows the user to select which scores are shown in the report. For example, to see the mean scale scores, select "Mean Scale Score" and click "Submit."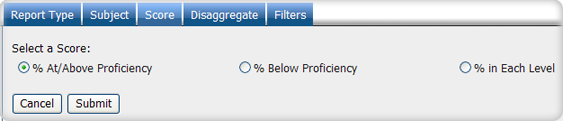
- Disaggregate
This feature allows the user to disaggregate the report by different subgroups. For example, to see statistics for different ethnicities, first select "Ethnicity" and then click "Submit."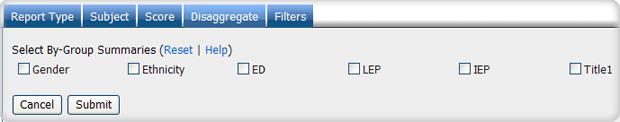
- Filters
This feature allows the user to include or exclude students based on demographic characteristics. To include one or more subgroups of students, click on the desired subgroup(s) of demographic variables from the drop-down list. Then, click on the word "and" or "or" to specify the logical relationship between the subgroups selected.
For example, to view students who are hispanic females, first click on "Female" under gender and "hispanic" under ethnicity, then select "and" for the logical relationship. This will display the scores of students who are hispanic AND female. Using the logical relationship "or" will display the scores for all hispanic students and for all female students, independent of each other.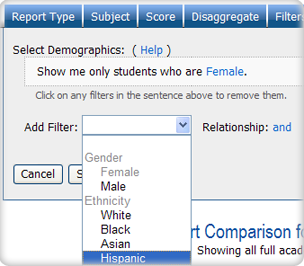
Macros
PSSA Data Booklet
The PSSA Data Booklet can be downloaded as either a PDF or Word file. This report is an overview of your PSSA Reading and Mathematics results for the past three years. It offers you quick access to easy-to-understand graphical displays of your PSSA results, including disaggregation by student populations, or "subgroups."
Getting Results!TM Work Online
Getting Results!TM Work Online allows you to choose a bar chart or histogram and the report you would like graphed. It also serves as an interactive
"worksheet," where you can create and answer questions right next to the graphical
data results.PACT Results
The PACT Results are downloaded as a PDF file. This report is a portrait of your three-year PSSA results broken down into performance level percentages.
Getting Results!TM Data Submission Packet
The Getting Results!TM Data Submission Packet is downloaded as a PDF file. This reports is a portrait of your three-year PSSA results, disaggregated by student populations and reporting categories.
Scatter Plot
- Enter the Roster Report and choose the scores that you are interested in under Scores:
- Optionally, apply a demographic or search filter to narrow your group of students down.
- In the Roster Report, click on the score column you would like on the x-axis and then click "Plot Against" and select the other score.
Advanced Features
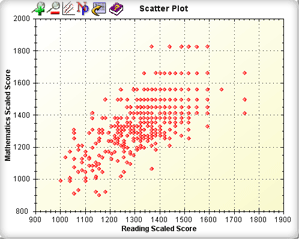
Once you see your Scatter Plot, you can print it directly from the browser by choosing File > Print or by pressing Ctrl+P. Also, you can:- Click the
 button to display a regression line with prediction bands.
 - Click the
 button to display the N-count and correlation coefficient for the scatter plot.
 - Zoom in on a particular rectangular portion of the graph. First, select a region by:
- Click ONCE on the starting point of your region.
- Click ONCE on the finishing point of your region.
 button to Zoom in. Clicking the
  button will zoom back out.
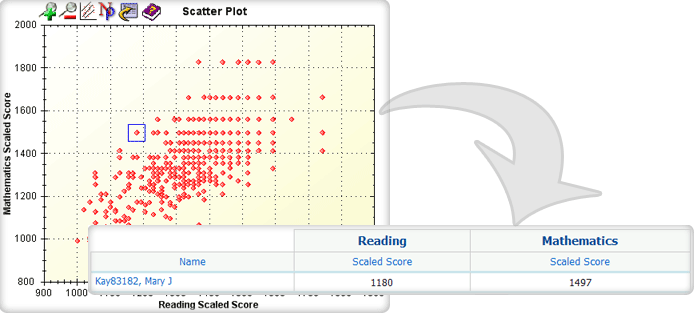
- View a Roster Report for a particular region of students by:
- Selecting a region of students (see above).
- Clicking the
 button.
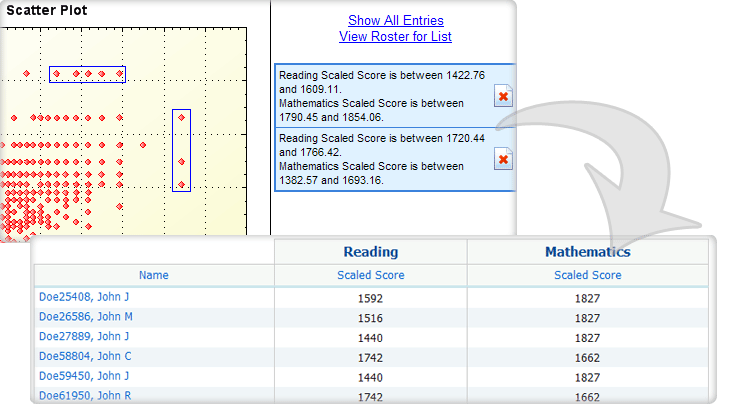
- View a Roster Report for multiple regions of students by:
- Selecting the first region of students (see above).
- Clicking on "Create List."
- Selecting a subsequent region of students and click on "Add Entry."
- Repeating step 3 until you have selected your desired regions. To see what you have selected, click on "Show All Entries." To undo or remove a region, click on the
 button.
 - Clicking on "View Roster for List."
Control Panel
Control Panel
The control panel inside the Data Interaction system allows administrative users to create users accounts with different privileges at the district, school, and content levels.
Getting Started
The control panel can be accessed by clicking on "Control Panel" located at the top right of the screen.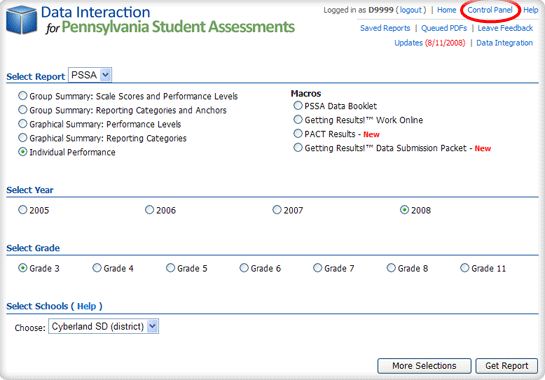
Making a Selection
Please choose an option: "Add User Accounts," "Deactivate User Account," "View User Accounts," or "View User Activity."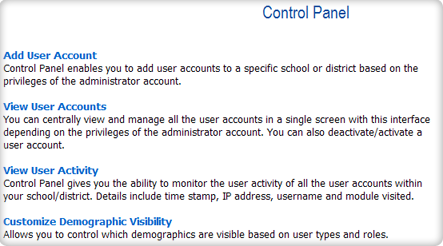
Add User Accounts
Add user accounts allows for the creation of user accounts for a specific district
or school.
To create new user accounts, click "Add User Accounts."
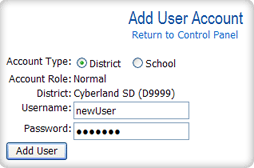
Select the type of account (see below) and any other additional information that the system asks for. Enter the new username and password and select "Add User."
Types of Accounts
District Administrator Users have access to all the data for their specified districts. The district administrator is able to:
- Upload data for data integration.
- Access the control panel to create, deactivate, modify and view user accounts.
School Administrative Users have access to all the data for their specified schools. The school administrator is able to:
- Access the control panel to create, deactivate, modify, and view user accounts.
Content Specific Users have access to all the data for their specified contents within their schools.
Deactivate User Accounts
"Deactivate User Accounts" allows an administrative user to activate or deactivate existing user accounts.
To deactivate or activate existing user accounts, click "Change Status."
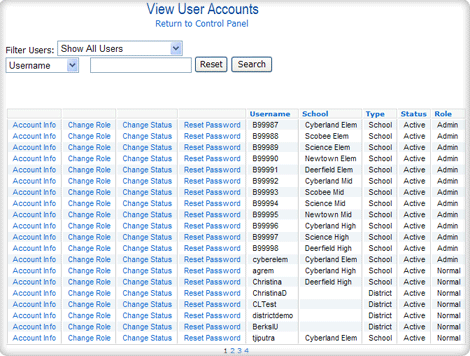
View User Accounts
"View User Accounts" provides a list of all user accounts and allows for the management of user accounts on a single screen. From the View Users Accounts page, users can view the account information by username, change the role of any account (i.e. administrative or normal), reset passwords, and activate or deactivate user accounts. The list of user accounts can be filtered by using the drop-down box or the search box at the top of the list.
To view account information for a particular user, click on the corresponding "Account Info" link. Here you can view the user information and deactivate/activate or delete user accounts.
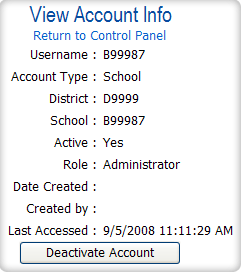
Deactivate User will deactivate the user account. If the account is deactivated by mistake, it can be activated again.
Delete User will remove the username from the list of users. The username cannot be used again once it is deleted.
Change Role allows the administrative user to change the privileges of a specified account. By clicking on “Change Role,” the user can toggle between administrative or normal for the specified account.
Reset Password allows the administrative user to reset passwords for other user accounts.
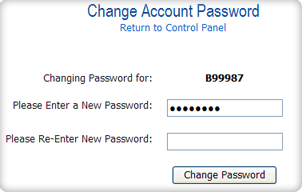
To reset a password, simply type in the same new password in each text box and click "Change Password."
Activate/Deactivate allows the status of the account to be toggled between active and inactive. When an account is inactive, the username and password will not provide access into Data Interaction.
View User Activity
"View User Activity" displays all user activity within the district or school. Detailed information, such as time stamp, IP address, username, and module visited, is provided.
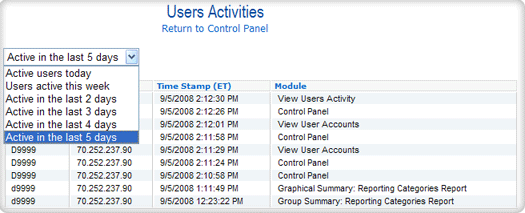
The drop-down box above the table allows for filtering by different time periods. This list can be sorted.
Customize PSSA Demographic Visibility
"Customize PSSA Demographic Visibility" allows district level administrative users to control which demographics are visible based on user types and roles.
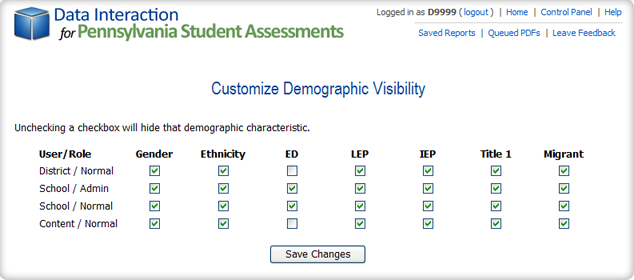
Unchecking a checkbox will hide that demographic characteristic from the users with the corresponding user type and role.
Individual Score Interpretation
Scale Score - A transformation of the raw score
points used to remove the effects of test length and difficulty and to establish
a common metric that measures achievement on the academic standards within and across
years. Minimum score is 700.
Total Raw Score - The number of raw score points
received on a test.
MC Total - Total raw score for multiple-choice
items. An MC item is a type of item where the student has up to four pre-written
answers from which he/she must select the most appropriate answer choice.
OE Total - Total raw score for open-ended items.
An OE item is a type of item that requires students to construct their own written
responses rather than choose from a list of pre-written options.
Performance Levels - Correspond with student scores
on the PSSA and are used to measure student proficiency on the assessments. The
performance levels are required by the State Board's Chapter 4 regulation. The four
levels are as follows:
Below Basic - The Below Basic Level reflects inadequate academic performance. Below Basic work indicates little understanding and minimal display of the skills included in the Pennsylvania Academic Content Standards. There is a major need for additional instructional opportunities and/or increased student academic commitment to achieve the Proficient Level.
Basic - The Basic Level reflects marginal academic performance. Basic work indicates a partial understanding and limited display of the skills included in the Pennsylvania Academic Content Standards. This work is approaching (but has not reached) satisfactory performance. There is a need for additional instructional opportunities and/or increased student academic commitment to achieve the Proficient Level.
Proficient - The Proficient Level reflects satisfactory academic performance. Proficient work indicates a solid understanding and adequate display of the skills included in the Pennsylvania Academic Content Standards.
Advanced - The Advanced Level reflects superior academic performance. Advanced work indicates an in-depth understanding and exemplary display of the skills included in the Pennsylvania Academic Content Standards.
The Department of Education, along with others, used two statistical standard setting procedures to develop the performance levels; the bookmark and borderline group method were used to develop the following reading and math levels:
| 2005: Grade 5 | ||
|---|---|---|
| Performance Level | Math Range | Reading Range |
| Advanced | 1460 and above | 1480 and above |
| Proficient | 1300 - 1459 | 1300 - 1479 |
| Basic | 1170 - 1299 | 1160 - 1299 |
| Below Basic | 1169 and below | 1159 and below |
| 2005: Grade 8 | ||
|---|---|---|
| Performance Level | Math Range | Reading Range |
| Advanced | 1510 and above | 1490 and above |
| Proficient | 1300 - 1509 | 1280 - 1489 |
| Basic | 1180 - 1299 | 1130 - 1279 |
| Below Basic | 1179 and below | 1129 and below |
| 2005: Grade 11 | ||
|---|---|---|
| Performance Level | Math Range | Reading Range |
| Advanced | 1490 and above | 1520 and above |
| Proficient | 1310 - 1489 | 1290 - 1519 |
| Basic | 1180 - 1309 | 1140 - 1289 |
| Below Basic | 1179 and below | 1139 and below |
Invalid Score Codes
- P - Parental
- SAA - State Alt Assessment
- EAb - Ext. Absence
- Ot - Other
- Ab - Absent
- NE - Non-attempt and no exclusion marked
- MuC - Multiple Codes
- ME - Medical Emergency
- CA - Court/Agency Placed and does not have IEP
- LP1 - LEP in first year of enrollment in US Schools
- MV - Student has moved (PASA only)
- NV - The score was not valid
- N/A - Student did not receive a score
Demographics
School - School Code (Individual Performance selection
menu only).
Gender - Student Gender;
M=Male, F=Female, U=Unspecified.
M=Male, F=Female, U=Unspecified.
Ethnicity - Student Ethnicity;
W=White Non-Hispanic, B=Black or African American Non-Hispanic, H=Latino or Hispanic, A=Asian, I=Native American or American Indian, M=Multiracial, U=Unspecified.
W=White Non-Hispanic, B=Black or African American Non-Hispanic, H=Latino or Hispanic, A=Asian, I=Native American or American Indian, M=Multiracial, U=Unspecified.
ED - Economically Disadvantaged; determined through
eligibility for free and reduced price lunch;
Y=Yes, N=No.
Y=Yes, N=No.
LEP - Limited English Proficient; a student whose
native language is not English or a student who is in the process of learning English and has sufficient
difficulty speaking, reading, and writing or understanding the English language as
measured by an English language proficiency test, so as to be denied the opportunity
to learn successfully in classrooms where the language of instruction is English;
Y=Yes, N=No.
Y=Yes, N=No.
IEP - Individualized Education Plan; usually related to Special Education. A written plan (includes how a child currently performs in school, specifies the student's educational needs, includes goals and objectives the parents and staff believe the student can achieve during the school year, includes details about the student's special education program, specifies why the child is receiving special education services, and provides an organized way for school staff and parents to conduct an appropriate educational program for the child) is developed by members of the local school district IEP team for a specific student;
Y=Yes, N=No.
Y=Yes, N=No.
Title I - A federal program that provides for
additional educational assistance to students in reading and mathematics;
Y=Yes, N=No.
Y=Yes, N=No.
Migrant - Children of migrant workers (Individual
Performance selection menu only); Y=Yes, N=No.
LEP1 - Limited English Proficient less than one
year (Individual Performance selection menu only);
Y=Yes, N=No.
Y=Yes, N=No.
Alt. Ed. - Approved Public Alternative Education
Program (Individual Performance selection menu only);
Y=Yes, N=No.
Y=Yes, N=No.
District1 - Student enrolled in this district
after October 1 (Individual Performance selection menu only);
Y=Yes, N=No.
Y=Yes, N=No.
School1 - Student enrolled in this school after
October 1 (Individual Performance selection menu only);
Y=Yes, N=No.
Y=Yes, N=No.
Home - Home school student assessed at parental
request (Individual Performance selection menu only);
Y=Yes, N=No.
Y=Yes, N=No.
DAFr - District Aggregation Flag for Reading (Individual
Performance selection menu only; not for 2004);
Y=Included in score aggregation, N=Excluded from score aggregation.
Y=Included in score aggregation, N=Excluded from score aggregation.
DAFm - District Aggregation Flag for Math (Individual
Performance selection menu only; not for 2004);
Y=Included in score aggregation, N=Excluded from score aggregation.
Y=Included in score aggregation, N=Excluded from score aggregation.
SAFr - School Aggregation Flag for Reading (Individual
Performance selection menu only; not for 2004);
Y=Included in score aggregation, N=Excluded from score aggregation.
Y=Included in score aggregation, N=Excluded from score aggregation.
SAFm - School Aggregation Flag for Math (Individual
Performance selection menu only; not for 2004);
Y=Included in score aggregation, N=Excluded from score aggregation.
Y=Included in score aggregation, N=Excluded from score aggregation.
DAF - District Aggregation Flag (Individual Performance
selection menu only; 2004 only);
Y=Included in score aggregation, N=Excluded from score aggregation.
Y=Included in score aggregation, N=Excluded from score aggregation.
SAF - School Aggregation Flag (Individual Performance
selection menu only; 2004 only);
Y=Included in score aggregation, N=Excluded from score aggregation.
Y=Included in score aggregation, N=Excluded from score aggregation.
CTE - Career and technical education students
(Individual Performance selection menu only);
1 = CTE full day, 2 = CTE career tech inst only-half day, 3 = home HS and recives CTE inst there, 4 = charter school with a CTE pgm, 5 = CTC part time
1 = CTE full day, 2 = CTE career tech inst only-half day, 3 = home HS and recives CTE inst there, 4 = charter school with a CTE pgm, 5 = CTC part time
Title III - Language instruction for limited English
proficient and immigrant students (Individual Performance selection menu only; not
for 2004);
1 = Title III Served, 2 = Title III Not Served, 3 = Former Title III Served but in the two year monitoring period, blank otherwise.
1 = Title III Served, 2 = Title III Not Served, 3 = Former Title III Served but in the two year monitoring period, blank otherwise.
ID - Student identification (Individual Performance
selection menu only; district and school level accounts only).
DOB - Student date of birth (Individual Performance
selection menu only; district and school level accounts only).
IEPD - Student Primary Disability, if IEP (Individual
Performance selection menu only; 2006 only);
01=Traumatic Brain Injury, 02=Hearing Impairment incl Deafness, 04=Specific Learning Disability, 06=Mental Retardation, 09=Orthopedic Impairment, 10=Emotional Disturbance, 11=Speech or Language Impairment, 12=Visual Impairment incl Blindness, 13=Deaf/Blind, 16=Multiple Disabilities, 21=Autism, 22=Other Health Impairment, blank otherwise.
01=Traumatic Brain Injury, 02=Hearing Impairment incl Deafness, 04=Specific Learning Disability, 06=Mental Retardation, 09=Orthopedic Impairment, 10=Emotional Disturbance, 11=Speech or Language Impairment, 12=Visual Impairment incl Blindness, 13=Deaf/Blind, 16=Multiple Disabilities, 21=Autism, 22=Other Health Impairment, blank otherwise.
Summary Score Interpretation
Number Tested - Number of students on which school, district or state results are based at each aggregation level.
% in Each Performance - The percentage of students at each of the four Performance Levels: Below Basic, Basic, Proficient and Advanced.
Statistic Interpretation
Total N - Number of students at the school, district, or state level.
Valid N - Number of students on which school, district, or state results are based at each aggregation level.
Mean - The average of the individual score values. It is calculated for Total Raw Score, Total Scale Score, and Reporting Category Raw Score.
Minimum - The minimum of the individual score values. It is calculated for Total Raw Score, Total Scale Score, and Reporting Category Raw Score.
Maximum - The maximum of the individual score values. It is calculated for Total Raw Score, Total Scale Score, and Reporting Category Raw Score.
S.D. - Standard deviation: the average dispersion of individual scores around the mean. It is calculated for Total Raw Score, Total Scale Score, and Reporting Category Raw Score.
Access Levels
Access Levels: There are three levels of access to the PSSA Data Interaction Application: State, District, and School. State-level users can view summary results at the state and district levels. They can also view students' scores and other demographic information; however, individual student information, such as names, birthdate, and student ID, are inaccessible. District-level users can view summary and individual results of their own districts and all the schools within their districts as well as the summary results of the state. School-level users can view summary and individual results of their own schools as well as the summary results of their districts and the state.
A new access level has been added to the PSSA Data Interaction Application. Intermediate Units (IU) are now able to access their summary results as well as the results of each district in their IU. They can also view students' scores and other demographic information; however, individual student information, such as names, birthdate, and student ID, are inaccessible.